


Modern technology provides incredible tools for helping menstruating individuals understand and track their cycles. Most people have apps on their phones that can help to project dates of optimal fertility by predicting ovulation. These apps are wonderful for so many people, especially for those who have very little experience tracking their cycles and are just learning how to understand how to predict upcoming cycles. However, a major caveat to using apps alone and sole predictors of fertility is that they are determined solely based on averages.
For example, somewhere somehow, we all learned that the average menstrual cycle is 28 days (this is an average, some variation does exist). Then we learned that you ovulate 14 days prior to the onset of the period, so in a perfect situation, an individual with a 28 day cycle ovulates on day 14. This is not always the case. Sometimes people can ovulate on day 13 or day 16. So for some individuals who are trying to conceive without success, it is always useful to get really specific about when ovulation is occurring.
Chinese medicine has demonstrated an uncanny ability to understand and account for the small tendencies that bodies experience as they move throughout a cycle. From changes in sleep, sweating, digestion, appetite to emotional fluctuations and pain, Chinese philosophy understands why some of these changes occur and use them to understand individual dynamics.
I frequently get asked “how can I know exactly when I am ovulating?” And the answer is fairly simple – Start charting basal body temperature (BBT for short)! Your basal body temperature is generally known to be the lowest body temperature that occurs while resting. In order to observe your BBT it is important that temperature is taken (under the tongue) immediately upon waking. It is best to take your temperature at the same time every day, first thing in the morning, before even getting out of bed. Once you stand up and start moving your temperature rapidly increases and is no longer your BBT. This routine is then repeated daily in order to provide an overview of BBT temperature throughout the length of a menstrual cycle.
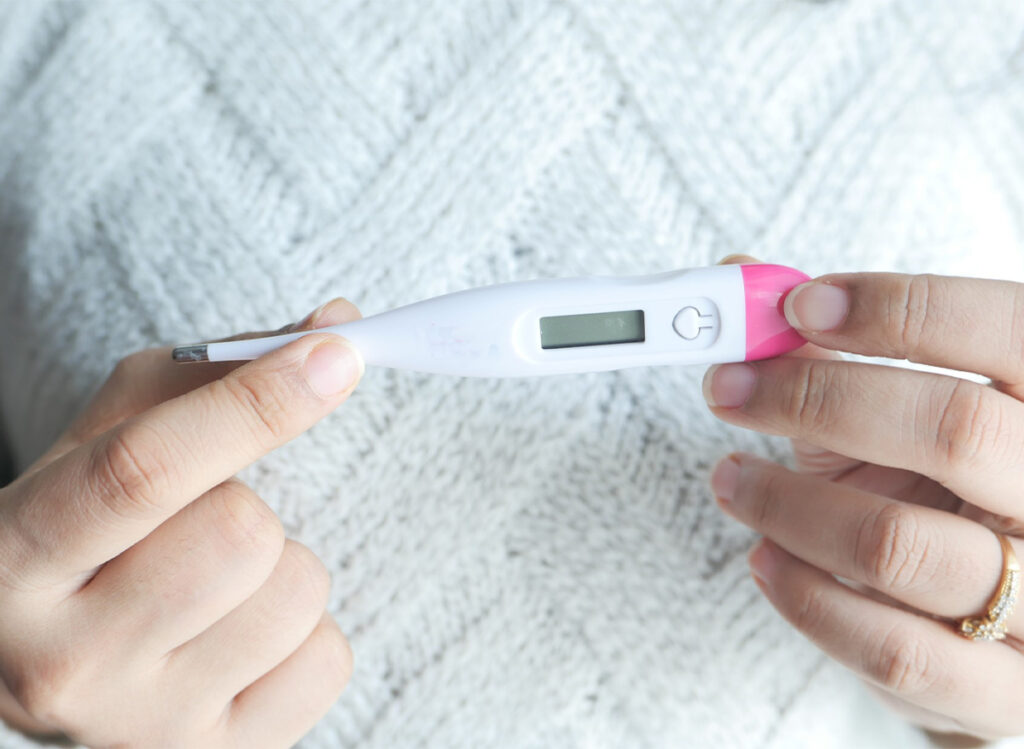
Charting your BBT
All you need to chart your BBT is an oral thermometer that reads to the tenth decimal and a paper chart to keep track. I like this particular chart that you can download: https://www.tcoyf.com/downloadable-charts/
Day one of the menstrual cycle is the first day of bleeding. When charting a cycle it’s useful to start right at the beginning and then continue for the length of the cycle. This is helpful to determine the actual length of a cycle and begin to begin observing trends. There are many other signs and symptoms that can be recorded throughout the length of the cycle including, but not limited to sleep, body pain and cramping, breast tenderness, cervical fluid, headaches, energy levels, alcohol consumption and whether or not you were sick at all. Continue with this process on the same chart until your next first day of bleeding.
Understanding the BBT chart:
The first half of the cycle (average about 14 days) is known as the ‘follicular phase.’ This phase consists of the bleeding phase as well as the preovulatory phase. It is during this stage that eggs are maturing inside the follicles of the ovaries. One eventually takes over and gets released from the ovary, which is known as ‘ovulation.’ After an egg is released you enter into the post ovulatory phase known as the ‘luteal phase.’ During this time, the body produces a hormone called progesterone. Progesterone has an impact on the body temperature by warming it slightly.
What this means is that immediately following ovulation, the BBT is expected to move through what is called a ‘thermal shift’ where the temperature begins to rise relative to temperatures during the follicular phase. On average the thermal shift can measure to be about 0.5º F to 1º F. If it is much lower than this, or if there is no thermal shift recorded than this can indicate some internal imbalance. In order to determine which day ovulation occurred, you would identify which day that your temperature started to climb, and this would indicate your ovulation. In general the luteal phase tends to be more stable where it is the same length of days repeatedly, where the follicular phase can vary on occasion from cycle to cycle.
What is normal?
Of course there is no standard that all bodies follow, however the average cycle can vary between 26 and 32 days. And this number may change slightly from cycle to cycle, or there may be a repeating pattern. Ovulation can also vary, although when you start to track your menstrual cycles regularly you may see that the time between ovulation and onset of menses tend to remain relatively stable. Also, there are many things that can interfere with the cycle including getting sick, traveling and stress, so tracking these external conditions while you chart can help shed light on any inconsistencies you may experience. Pain and cramping, while common is not necessarily normal, especially if it is debilitating or induces nausea. While cycle tracking using BBT, it can be much easier to record some other symptoms that may occur in tandem with the menstrual cycle.
According to Chinese Medicine, all of these signs and symptoms associated with the cycle are clues that there may be an internal imbalance. Using a tracking system can be a wonderful place to start identifying what is actually happening internally, while also empowering individuals to be able to decipher the transitions they experience both biologically and over time.